Data Visualization
Tracing AI Images Back to the Source
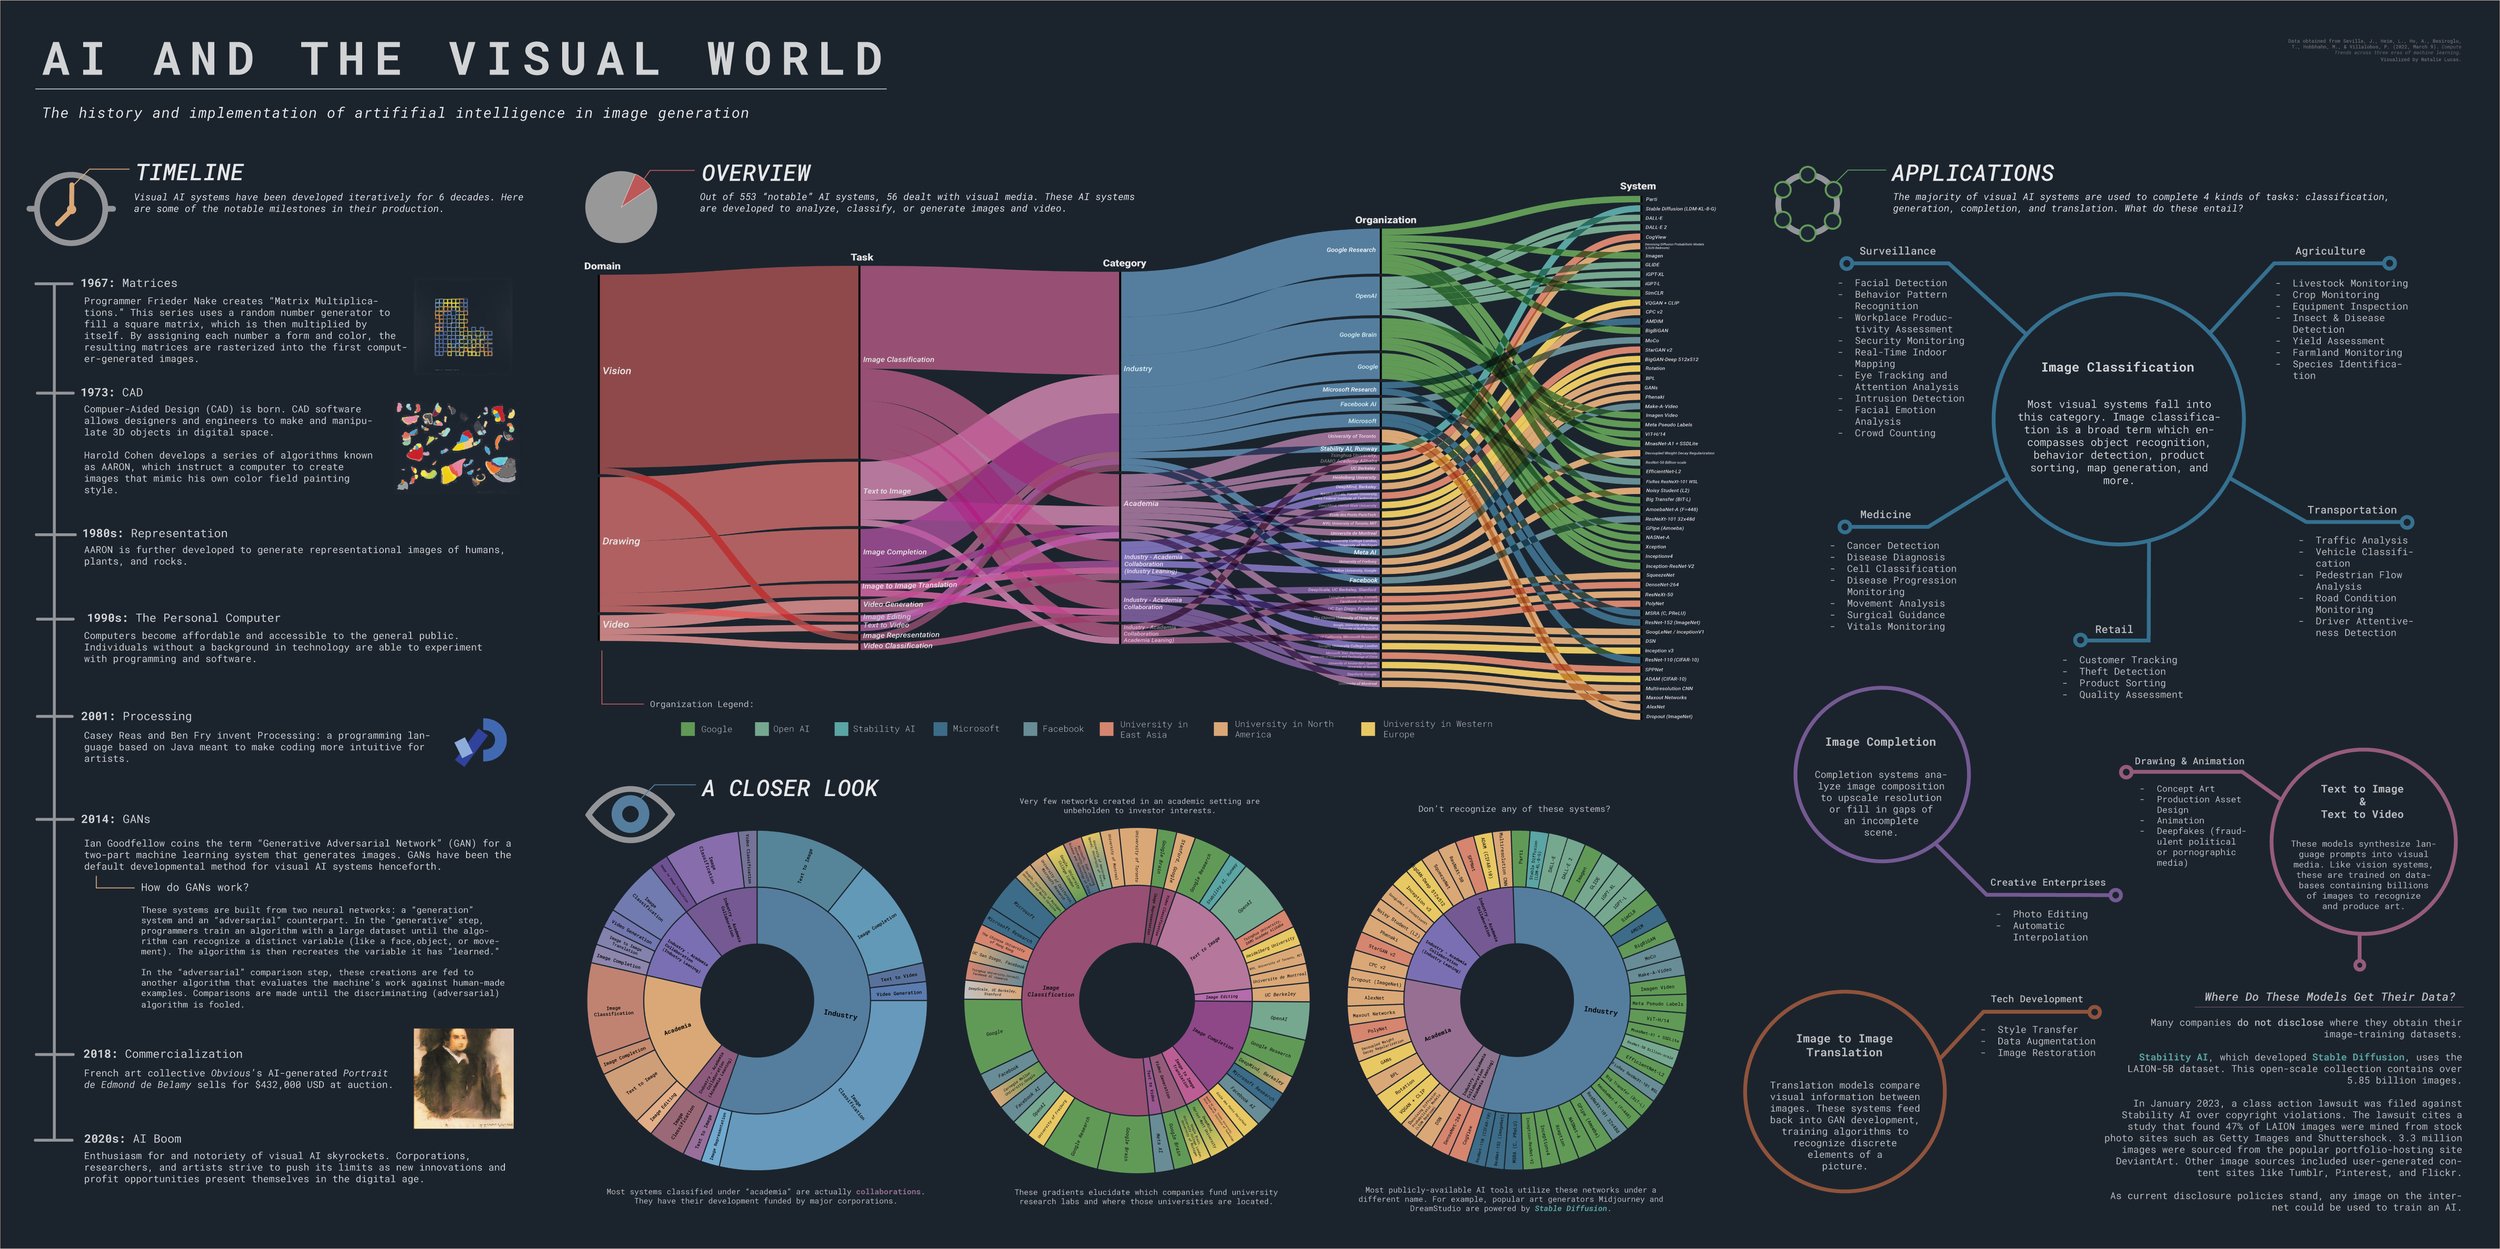
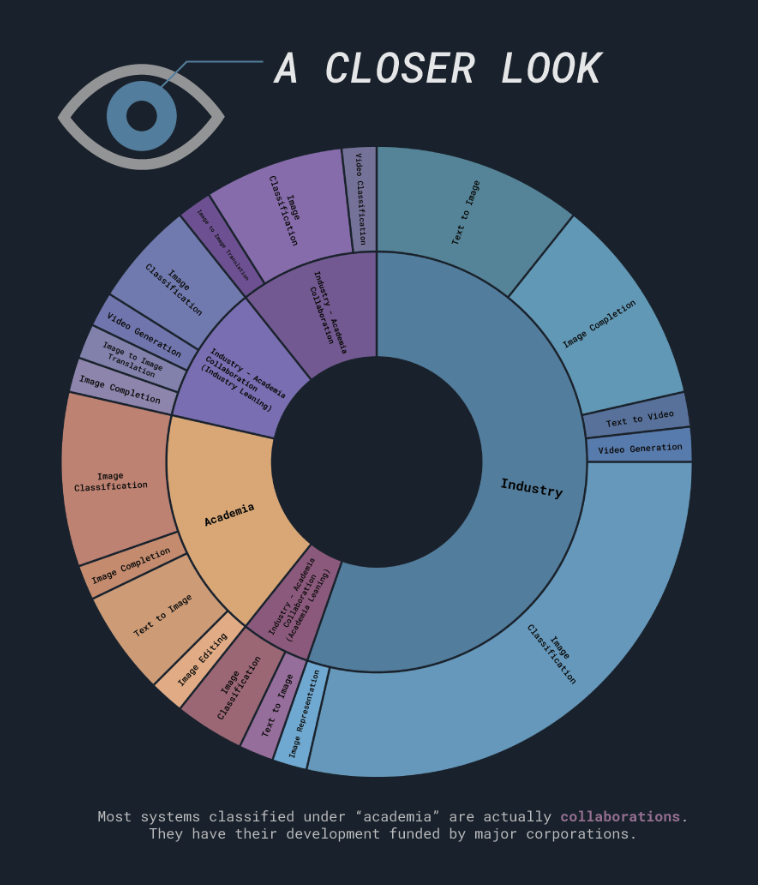
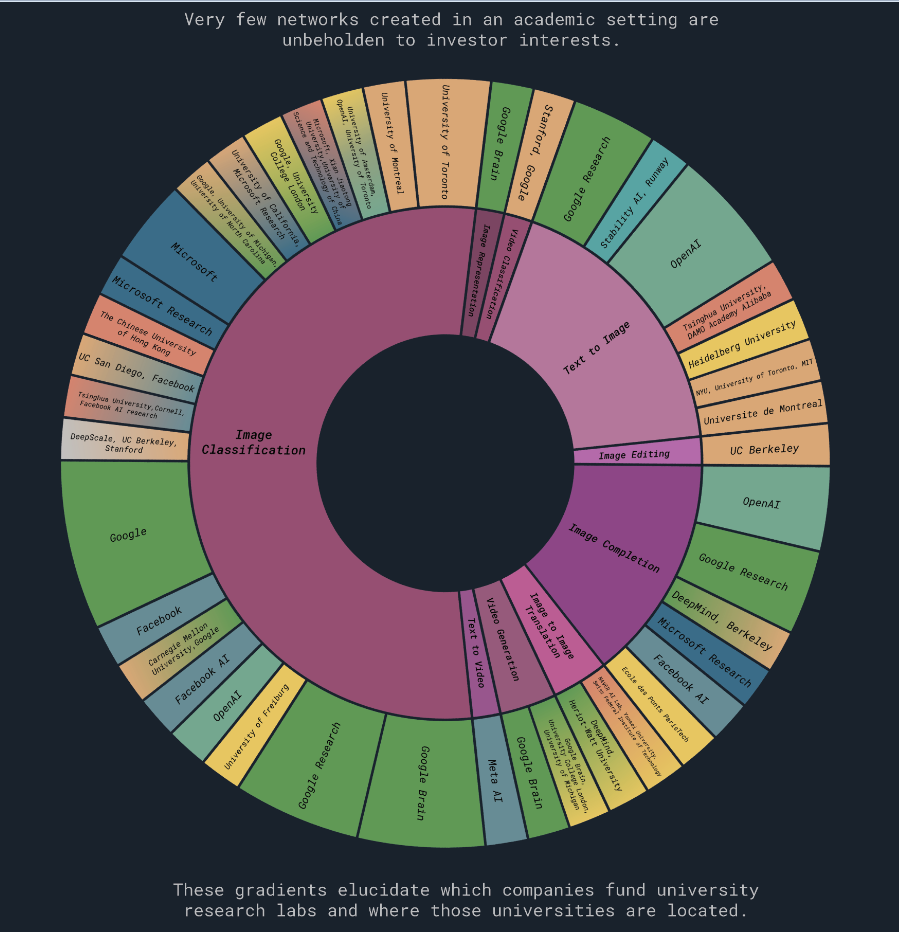
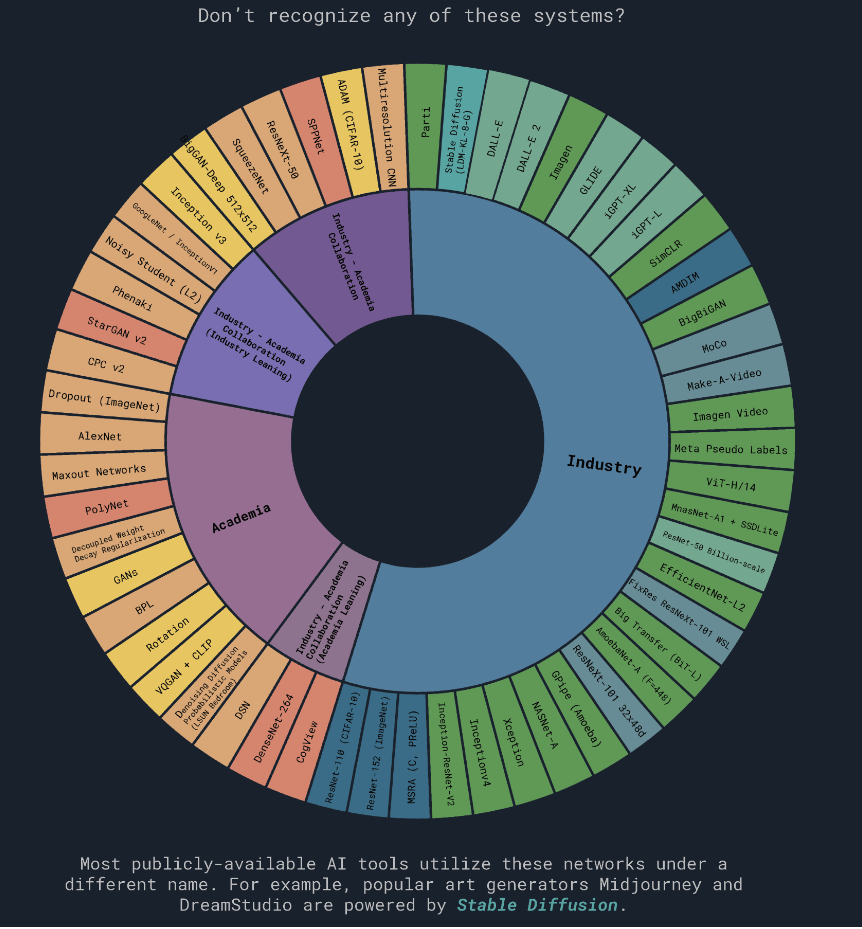
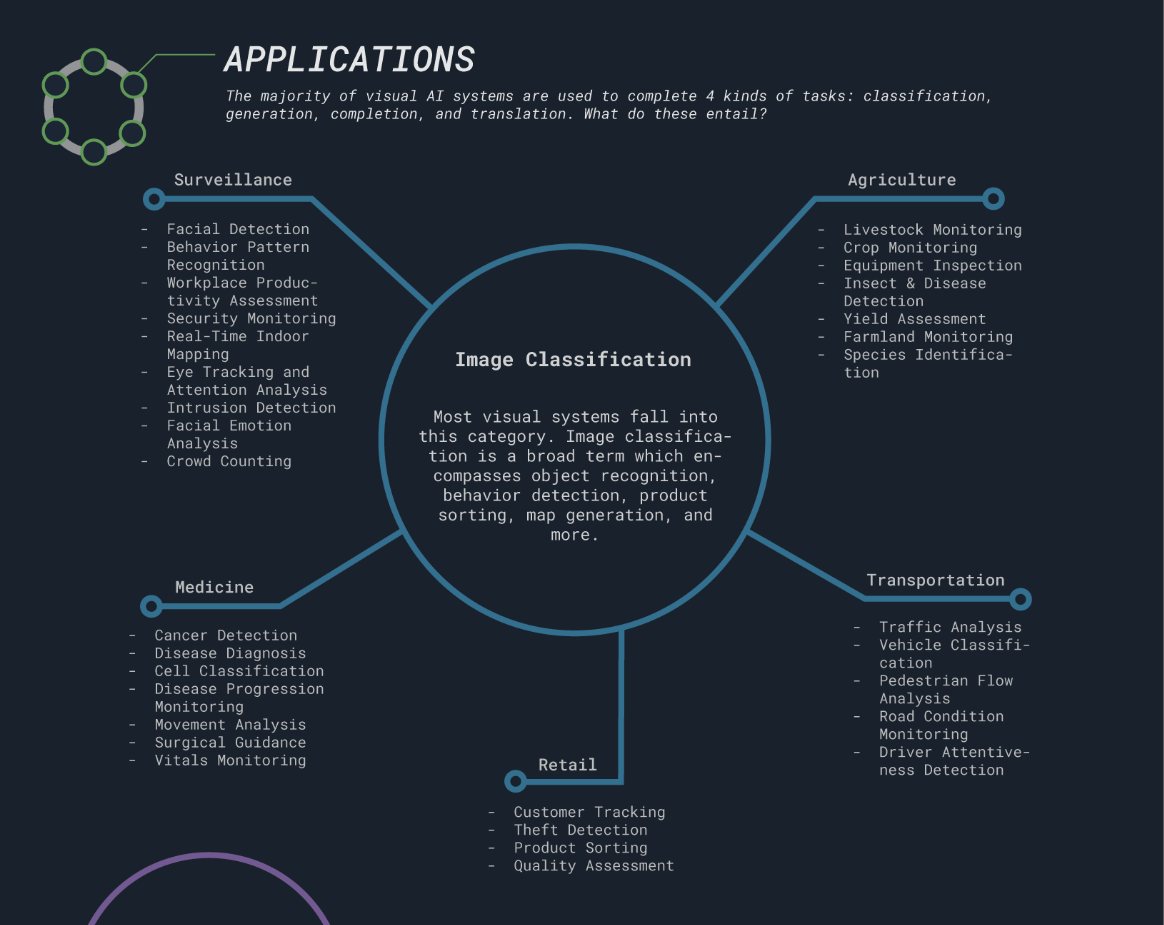
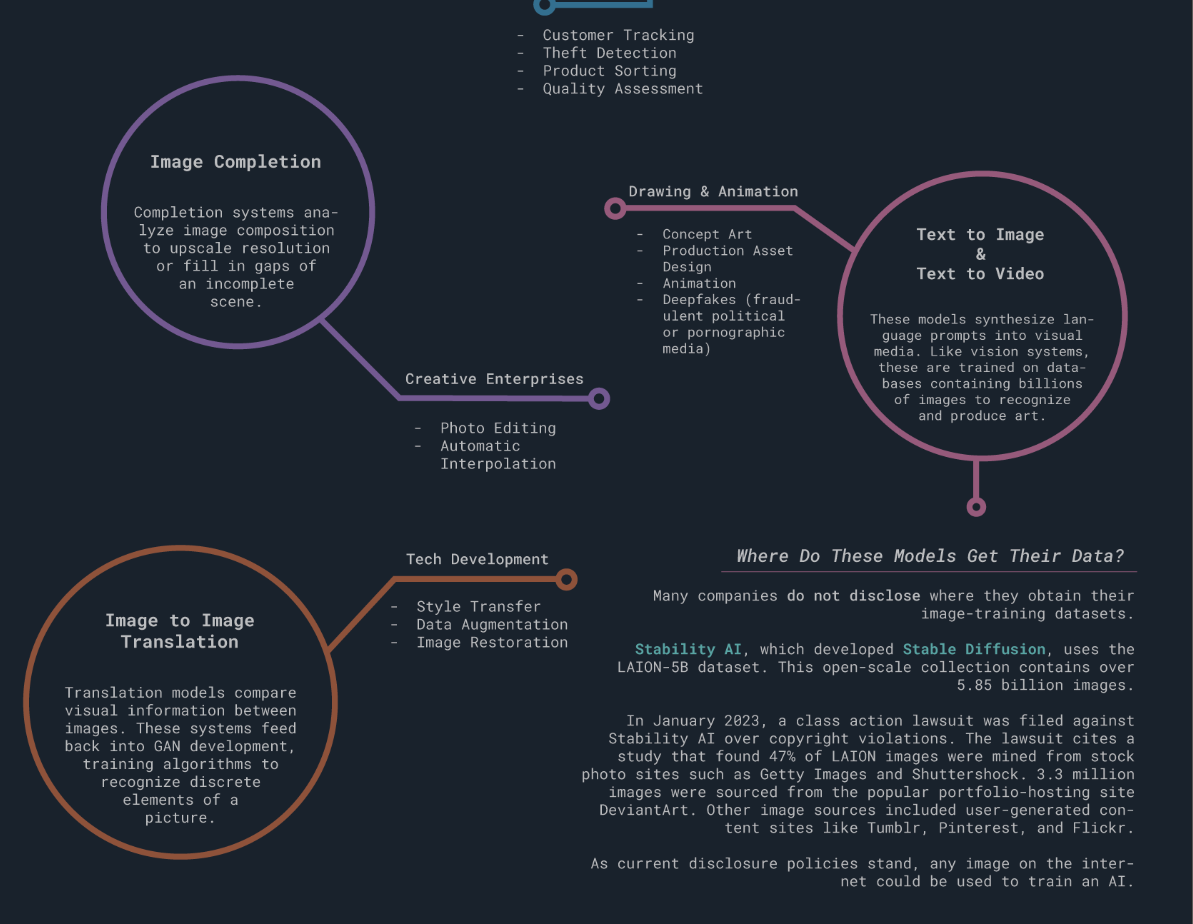
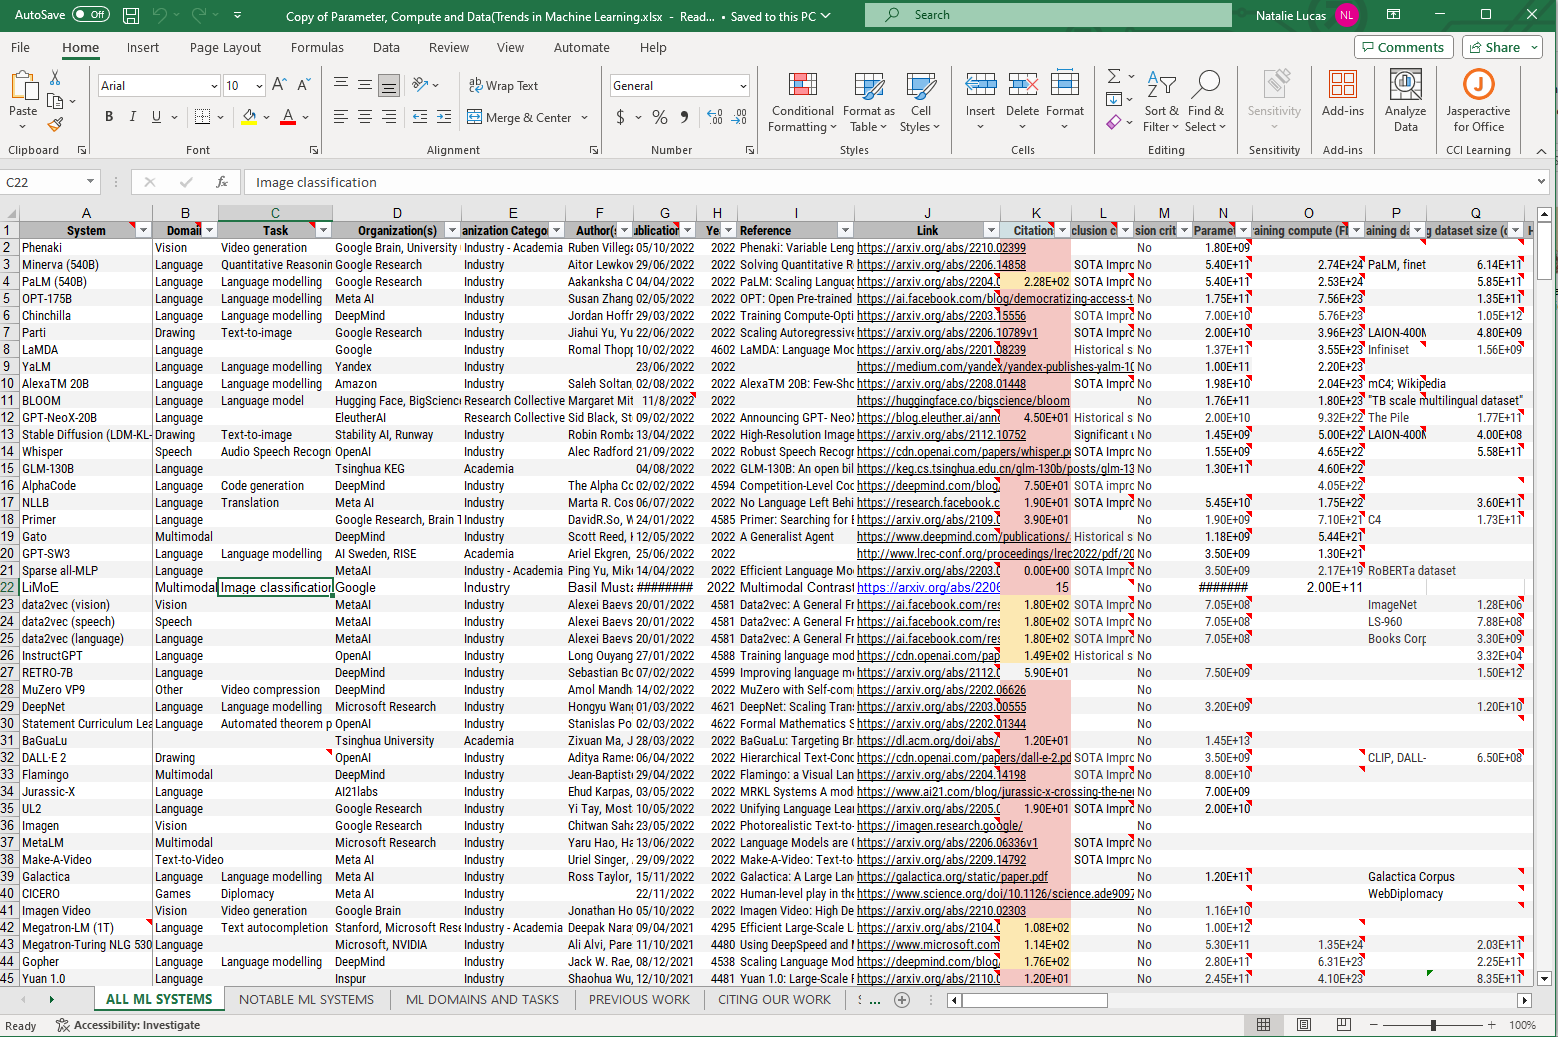
I constructed this infographic in the spring of 2023, when the generative artificial intelligence boom was in its infancy. In-depth research revealed how companies develop these models, how they are trained, and where they acquire training data. I depicted my findings in an intuitive visual format to promote transparency in AI sourcing.
This infographic—meant to be displayed as a 48” poster—enumerates the extant models, who owns them, and their functions.